Here is a new study from Outdoorsy looking at the impact outdoor recreation has on state economies in the United States. In 2020, 7.1 million more people headed outdoors, and overall participation in outdoor recreation surpassed 52% for the first time on record, according to the Outdoor Industry Association (OIA).
With consumers heading outside in record numbers, the industry’s contribution to the U.S. economy is likely to grow. Some states rely on revenue generated from outdoor recreation more than others. Researchers created a composite index based on the outdoor recreation industry’s share of GDP, employment, and compensation in each state and ranked states accordingly.
Below you’ll find a summary of the analysis—please feel free to republish or use the findings in your own write-up. If you choose to use the analysis, please link to the original report, which includes a table with data on all 50 states: https://www.outdoorsy.com/blog/state-economies-dependent-outdoor-recreation

State Economies Most Dependent on Outdoor Recreation
Over the past year, pandemic-related shutdowns inspired Americans to head outdoors to find open, safe places to relax and exercise in record numbers.
In 2020, 7.1 million more people headed outdoors, and overall participation in outdoor recreation surpassed 52% for the first time on record, according to the Outdoor Industry Association (OIA). Among the most popular activities was fishing, which drew higher numbers of participants across multiple age, race, and gender groups.
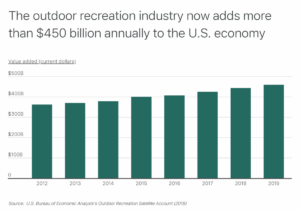
The surge in outdoor participation undoubtedly provided a boost to the outdoor recreation industry that was already booming before the pandemic hit. In 2012, the industry contributed about $350 billion to the U.S. economy. Heading into 2020, that contribution jumped to more than $450 billion. And with consumers heading outside in record numbers over the past year, the industry’s contribution to the economy is likely to grow.
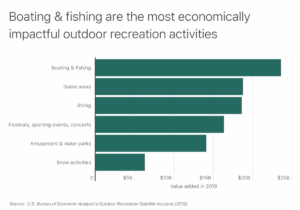
The U.S. Bureau of Economic Analysis categorizes “outdoor activities” into a broad spectrum of hobbies and exercises, including: boating and fishing; sports like golf and tennis; RVing; festivals, sporting events, and concerts; amusement and water parks; and snow activities like skiing and snowboarding.
Among these activities, boating and fishing adds the most value to the economy, accounting for a nearly $25 billion impact in 2019. That number is likely to go up, as boat sales increased by 13% in 2020. Those who fared well financially during the pandemic likely had the extra resources to purchase a boat, either fulfilling a lifelong dream or providing their family a new way to enjoy the outdoors.
For those on tighter budgets, fishing presented an economical option to enjoy the outdoors and time spent with friends and relatives. The number of first-time fishing participants jumped 42% in 2020, leading U.S. Fish and Wildlife Service Principal Deputy Director Martha Williams to tell OIA, “We are thrilled to see so many new and returning anglers enjoying our nation’s waters.”
Sports-based recreation and RVing were the second and third most impactful activities, according to Bureau of Economic Analysis data.
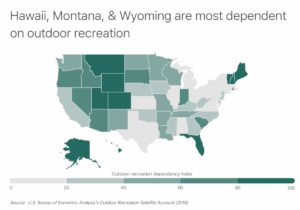
The boost in outdoor participation seen across the country in 2020 was particularly beneficial to states dependent on outdoor recreation economically. To identify the states most dependent on outdoor recreation, researchers at Outdoorsy analyzed data from the Bureau of Economic Analysis and created a composite index based on the outdoor recreation industry’s share of GDP, employment, and compensation in each state.
Based on these factors, Outdoorsy identified a diverse set of states—both coastal and mountainous—that topped the list. Notably, Hawaii was the only state in which outdoor recreation made up at least 5% of its GDP, employment, and compensation. In the Mountain Region, Montana and Wyoming stood out as the two states most economically dependent on outdoor recreation.
 Here are the state economies most dependent on outdoor recreation.
| State | Rank | Outdoor recreation dependency index | Outdoor recreation share of GDP | Outdoor recreation share of employment | Outdoor recreation share of total compensation | Largest economic impact activity |
|---|---|---|---|---|---|---|
| Hawaii | 1 | 100.0 | 5.8% | 5.9% | 5.3% | Game Areas (including Golf & Tennis) |
| Montana | 2 | 94.8 | 4.7% | 4.5% | 4.1% | Boating & Fishing |
| Wyoming | 3 | 94.2 | 4.2% | 5.2% | 4.1% | Snow Activities |
| Vermont | 4 | 93.2 | 5.2% | 4.4% | 3.6% | Snow Activities |
| Florida | 5 | 91.6 | 4.4% | 4.0% | 3.9% | Amusement & Water Parks |
| Maine | 6 | 91.2 | 4.2% | 4.7% | 3.4% | Boating & Fishing |
| Alaska | 7 | 89.8 | 3.9% | 4.5% | 3.6% | Boating & Fishing |
| Utah | 8 | 85.4 | 3.3% | 3.9% | 3.1% | Snow Activities |
| New Hampshire | 9 | 82.8 | 3.2% | 4.1% | 2.7% | Snow Activities |
| Colorado | 10 | 81.2 | 3.1% | 3.8% | 2.9% | Snow Activities |
| Idaho | 11 | 78.6 | 3.0% | 3.4% | 2.9% | RVing |
| Nevada | 12 | 75.8 | 3.1% | 3.1% | 2.8% | Boating & Fishing |
| Oregon | 13 | 75.8 | 2.9% | 3.4% | 2.8% | RVing |
| South Carolina | 14 | 74.6 | 2.9% | 3.5% | 2.5% | Boating & Fishing |
| South Dakota | 15 | 69.6 | 2.5% | 3.3% | 2.5% | RVing |
| United States | – | N/A | 2.1% | 2.5% | 2.0% | Boating & Fishing |
For more information, a detailed methodology, and complete results, you can find the original report on Outdoorsy’s website: https://www.outdoorsy.com/blog/state-economies-dependent-outdoor-recreation

