Fishing is among the nation’s most popular pastimes, with more than 50 million Americans going fishing each year. The sport is enjoyable for participants of all ages and athletic abilities, easy to learn, and offers time to relax and enjoy nature, making it a great hobby for people from all walks of life.
Fishing has long been popular among Americans, but in more recent decades, the growth of fishing has also become an important component of conservation and habitat restoration efforts in the U.S. Revenue derived from fishing licenses helps finance federal, state, and local programs for wildlife protection. State agencies directly use license revenue to fund wildlife agencies, while federal programs often use the volume of licenses sold per state as part of the basis for apportionments of federal wildlife funds. Governments also frequently generate revenue related to fishing in other ways as well, such as excise taxes on angling equipment.
The Growing Popularity of Fishing
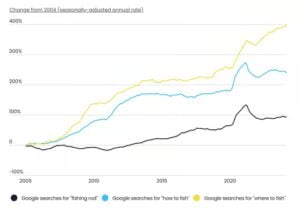
The pandemic amplified America’s growing interest in fishing.

According to Google Trends data since 2004, search interest in the term “fishing rod” has increased by more than 90%, while searches for “how to fish” are up nearly 250%, and searches for “where to fish” are up by nearly 400%. Each of these search terms also saw pronounced spikes during the COVID-19 pandemic, when fishing emerged as a popular activity that allowed people to get outside while remaining a safe distance—a phenomenon some have called “social fishtancing.” While search volume for fishing-related terms decreased slightly following the pandemic, each has continued an overall upward trend in recent years.
FISHING IN MONTAUK
The “Fishing Capital of the World” is home to many fishing world records and has something to offer every type of angler. And while Montauk can be a highly seasonal fishery, summer brings some of the most exciting opportunities of the year. Our Montauk fishing charters will help you discover the experience you’re looking for.
Fishing License & Revenue Growth
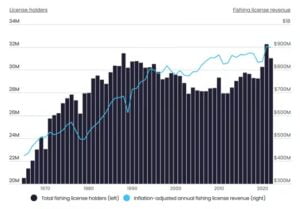
The increased popularity of fishing has generated more funds for wildlife and conservation programs.

Increased interest in fishing is also good news for conservation efforts and the government agencies responsible for managing fish and wildlife conservation. Since the late 1960s, the total number of fishing license holders in the U.S. has risen by more than half, from 20.5 million to 31.0 million. Over the same span, total revenues from fishing license sales have more than doubled after adjusting for inflation, from $424 million to $898 million in 2023 dollars. This means that more funding is flowing into efforts to preserve fish habitats.
The Ultimate Fishing Destination
Home to less than 10,000 people, Orange Beach, Alabama just might be the ultimate fishing destination. With access to Alabama’s famous nearshore reef system, as well as the deep waters of the Gulf of Mexico, now is the best time of year to explore what many fishermen call the “Red Snapper Capital of the World.” Allow our expert Orange Beach fishing charters to lead the way.
Growth in Fishing Popularity by State
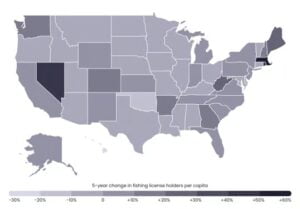
Massachusetts & Nevada reported the largest increase in fishing license sales in recent years.

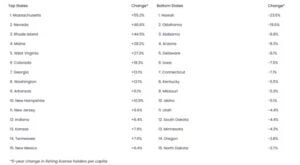
In recent history, some U.S. states have seen more rapid growth in the popularity of fishing than others. Between 2017 and 2022, the latest five-year period with available data, Massachusetts has led the country for the growth in fishing license holders per capita at 55.3%, with Nevada (46.6%) and Rhode Island (44.5%) also ranking highly. Despite growth in these states and at the national level, other states recorded decreases in license holders per capita over the same period. Notably, Hawaii and Oklahoma have seen the starkest declines at -23.5% and -19.6%, respectively.
Trending on Captain Experiences
The waters around Charleston are home to an expansive variety of fish, and now is the best time of year to catch them. We currently offer 67 different experiences in Charleston, ranging from inshore to deep sea, with options for both expert anglers as well as kids. Check out our Charleston fishing charters today, and book your next trip.
Top & Bottom States for Fishing License Growth
Below is a complete breakdown of fishing license growth by state. The analysis was conducted by Captain Experiences using data from the U.S. Fish & Wildlife Service. For more information, refer to the methodology section.

Methodology
The data used in this analysis is from the U.S. Fish & Wildlife Service’s Hunting & Fishing Licenses Data. The latest data shown is for apportionment year 2024, which reflects license sales that occurred in 2022. To determine the states where fishing popularity has grown the most, researchers calculated the percentage change in the number of fishing license holders per capita over the last five years. In the event of a tie, the location with the greater 10-year change in fishing licenses per capita was ranked higher. This information only includes paid licenses that meet the requirements of the Dingell-Johnson Sport Fish Restoration Act. The data is not representative of individuals who obtain free licenses or who are not required to hold licenses.
| Rank | State | 5-year change in fishing license holders per capita | 10-year change in fishing license holders per capita | 5-year change in fishing license revenue | 10-year change in fishing license revenue | Total fishing license holders | Annual fishing license revenue |
|---|---|---|---|---|---|---|---|
| 1 | Massachusetts | +55.3% | +31.5% | +27.3% | +15.2% | 273,849 | $6,947,055 |
| 2 | Nevada | +46.6% | +18.4% | +37.9% | +24.3% | 162,548 | $5,473,787 |
| 3 | Rhode Island | +44.5% | +286.9% | -17.1% | +65.8% | 96,703 | $878,138 |
| 4 | Maine | +28.2% | +31.2% | -4.0% | -0.6% | 367,124 | $9,394,339 |
| 5 | West Virginia | +27.3% | +36.1% | -7.7% | -14.1% | 319,178 | $6,203,706 |
| 6 | Colorado | +18.3% | +27.3% | +44.6% | +56.3% | 949,595 | $29,928,665 |
| 7 | Georgia | +13.1% | +61.6% | +19.0% | +38.3% | 1,114,640 | $15,747,703 |
| 8 | Washington | +12.1% | -7.8% | +6.7% | +3.3% | 716,371 | $37,046,370 |
| 9 | Arkansas | +11.1% | -18.0% | +2.2% | -8.5% | 549,773 | $9,923,689 |
| 10 | New Hampshire | +10.9% | +13.0% | -3.2% | +11.2% | 180,404 | $7,402,413 |
| 11 | New Jersey | +9.6% | +6.9% | +0.8% | -9.2% | 194,128 | $5,791,962 |
| 12 | Indiana | +8.4% | +21.2% | -14.4% | -16.9% | 570,322 | $7,874,092 |
| 13 | Kansas | +7.6% | +11.6% | -15.1% | +16.0% | 290,068 | $6,689,831 |
| 14 | Tennessee | +7.0% | +14.4% | +94.8% | +106.8% | 982,700 | $43,678,425 |
| 15 | New Mexico | +6.4% | +41.8% | +20.7% | +26.2% | 263,422 | $8,335,016 |
| 16 | Florida | +4.9% | +7.7% | +6.1% | +4.5% | 1,720,836 | $47,341,420 |
| 17 | Wyoming | +4.6% | +15.6% | +6.1% | +25.1% | 250,870 | $8,580,741 |
| 18 | California | +4.5% | -0.4% | +3.9% | -6.8% | 1,687,035 | $76,895,077 |
| 19 | Michigan | +3.5% | +5.1% | -10.7% | +10.5% | 1,154,958 | $29,831,447 |
| 20 | Pennsylvania | +3.1% | +11.3% | +3.1% | -2.5% | 1,114,744 | $30,308,912 |
| 21 | South Carolina | +3.0% | -9.6% | -19.1% | -26.8% | 577,416 | $6,360,006 |
| 22 | North Carolina | +2.0% | +3.1% | +15.4% | +33.9% | 1,404,125 | $28,658,118 |
| 23 | Virginia | +1.4% | -6.5% | +0.6% | +29.7% | 559,013 | $28,472,390 |
| 24 | New York | +1.3% | -8.7% | -10.7% | -35.3% | 884,664 | $21,770,145 |
| 25 | Alaska | +0.2% | +10.7% | -14.9% | -9.8% | 466,244 | $20,915,174 |
| 26 | Mississippi | -0.2% | -9.4% | -2.5% | -7.8% | 319,916 | $6,331,666 |
| 27 | Vermont | -0.3% | +2.7% | +1.2% | +15.5% | 122,922 | $4,190,940 |
| 28 | Louisiana | -0.9% | +0.1% | -26.7% | -17.7% | 736,070 | $11,113,122 |
| 29 | Nebraska | -1.6% | +16.0% | +2.1% | +24.5% | 241,835 | $8,004,692 |
| 30 | Ohio | -2.1% | +11.4% | +6.7% | +12.2% | 839,329 | $19,983,322 |
| 31 | Wisconsin | -2.1% | -2.8% | -23.7% | -10.7% | 1,366,447 | $34,623,011 |
| 32 | Illinois | -2.2% | -12.2% | -23.4% | -27.2% | 618,921 | $8,342,403 |
| 33 | Texas | -2.3% | +5.0% | -10.1% | -4.4% | 1,989,010 | $65,959,728 |
| 34 | Maryland | -2.4% | +3.4% | -14.9% | -13.9% | 301,530 | $8,893,543 |
| 35 | Montana | -3.6% | +13.4% | +10.3% | +67.7% | 459,939 | $22,968,713 |
| 36 | North Dakota | -3.7% | +9.2% | -15.3% | +48.5% | 209,053 | $4,027,973 |
| 37 | Oregon | -3.8% | -2.8% | +0.3% | +15.7% | 640,655 | $33,462,943 |
| 38 | Minnesota | -4.3% | -5.7% | -1.1% | +17.5% | 1,421,560 | $38,469,076 |
| 39 | South Dakota | -4.4% | +13.2% | -13.6% | +19.6% | 237,457 | $7,537,446 |
| 40 | Utah | -4.4% | -3.5% | +6.5% | +39.3% | 517,540 | $17,310,581 |
| 41 | Idaho | -5.1% | +8.3% | +23.8% | +37.0% | 557,974 | $18,358,838 |
| 42 | Missouri | -5.3% | -2.2% | -4.8% | -6.2% | 769,458 | $14,724,105 |
| 43 | Kentucky | -5.5% | +1.5% | -2.3% | -1.2% | 554,152 | $11,387,851 |
| 44 | Connecticut | -7.1% | -4.6% | -9.6% | -12.4% | 147,762 | $4,524,679 |
| 45 | Iowa | -7.5% | -5.5% | -3.6% | +5.6% | 353,931 | $10,018,528 |
| 46 | Delaware | -8.1% | -6.3% | -15.7% | -27.1% | 85,779 | $1,568,732 |
| 47 | Arizona | -8.3% | -1.7% | -1.1% | +13.2% | 414,433 | $14,421,017 |
| 48 | Alabama | -8.8% | -10.3% | +59.4% | +49.7% | 609,962 | $17,921,999 |
| 49 | Oklahoma | -19.6% | -8.8% | +24.3% | +19.7% | 630,807 | $13,064,637 |
| 50 | Hawaii | -23.5% | +65.5% | -11.6% | +89.1% | 3,413 | $25,541 |
References
- Butrus, Joey. Captain Experiences. (2023, August 2). Fishing: A Curious Sport. Retrieved on May 14, 2024 from https://captainexperiences.com/blog/fishing-a-curious-sport.
- Partner With A Payer. (2024). Funding Sources. Retrieved on May 14, 2024 from https://partnerwithapayer.org/funding-sources/.
- Climate Adaptation Science Centers. U.S. Geological Survey. (2021, August 23). New Research Shows Recreational Fishing Popular During Pandemic Due to ‘Social Fishtancing’. Retrieved on May 14, 2024 from https://www.usgs.gov/news/new-research-shows-recreational-fishing-popular-during-pandemic-due-social-fishtancing.
- U.S. Fish & Wildlife Service. (2024). Office of Conservation Investment. Retrieved on May 14, 2024 from https://www.fws.gov/program/wildlife-and-sport-fish-restoration/apportionments-and-licenses-data.
- U.S. Fish & Wildlife Service. (2024). Sport Fish Restoration. Retrieved on May 14, 2024 from https://www.fws.gov/program/sport-fish-restoration.

